
Filter by
SubjectRequired
LanguageRequired
The language used throughout the course, in both instruction and assessments.
Learning ProductRequired
LevelRequired
DurationRequired
SkillsRequired
SubtitlesRequired
EducatorRequired
Results for "échantillonnage (statistiques)"
 Status: NewStatus: Free Trial
Skills you'll gain: Matplotlib, Data Storytelling, Scientific Visualization, Visualization (Computer Graphics), Plot (Graphics), Data Visualization, Statistical Visualization, Box Plots, E-Commerce, Business Analytics, Scatter Plots, Data Processing, Histogram, Data Analysis, Exploratory Data Analysis, Graphing, Pandas (Python Package), Image Quality, Data Visualization Software, Python Programming
 Status: NewStatus: Free Trial
Skills you'll gain: Seaborn, Data Literacy, Plot (Graphics), Matplotlib, Scatter Plots, Statistical Visualization, Data Presentation, Data Visualization Software, Data Visualization, Box Plots, Exploratory Data Analysis, Data Storytelling, Data Processing, Data-Driven Decision-Making, Statistical Modeling, Statistical Analysis, Descriptive Statistics, Pandas (Python Package), NumPy, Python Programming
 Status: NewStatus: Free Trial
Skills you'll gain: Matplotlib, Box Plots, E-Commerce, Business Analytics, Data Visualization Software, Data Processing, Histogram, Data Analysis, Scatter Plots, Exploratory Data Analysis, Pandas (Python Package), Software Installation
 Status: NewStatus: Free Trial
Macquarie University
Skills you'll gain: Interactive Data Visualization, Pivot Tables And Charts, Data Visualization, Data Presentation, Data-Driven Decision-Making, Microsoft Excel, Correlation Analysis, Forecasting, Regression Analysis, Excel Formulas, Statistics, Statistical Hypothesis Testing, Descriptive Statistics, Data Analysis, Business Analytics, Statistical Inference, Box Plots, Statistical Analysis, Statistical Modeling, Statistical Visualization
 Status: Preview
École Polytechnique Fédérale de Lausanne
Skills you'll gain: Real Estate, Property and Real Estate, Return On Investment, Commercial Real Estate, Financial Analysis, Finance, Business Valuation, Investments, Price Negotiation, Economics, Capital Budgeting, Market Dynamics
 Status: Free
École normale supérieure
Skills you'll gain: Infographics, Geospatial Mapping, Geographic Information Systems, Graphic and Visual Design, Data Mapping, Graphics Software, Color Theory, Design Elements And Principles
What brings you to Coursera today?
 Status: NewStatus: Preview
Skills you'll gain: SAS (Software), Statistical Modeling, Regression Analysis, Statistical Analysis, Predictive Modeling, Statistical Methods, Statistical Hypothesis Testing
 Status: Preview
University of Illinois Urbana-Champaign
Skills you'll gain: Descriptive Statistics, Sampling (Statistics), Statistical Inference, Statistical Analysis, Statistical Methods, Data Analysis, Data Presentation, Quantitative Research, Histogram, Microsoft Excel, Statistical Visualization, Probability Distribution, Graphing, Influencing
 Status: Preview
Johns Hopkins University
Skills you'll gain: Data Science, Data Literacy, Project Design, Data Analysis, Data Management, Data Presentation, Data-Driven Decision-Making, Business Analytics, Performance Metric, Machine Learning, Statistical Inference
 Status: NewStatus: Preview
Skills you'll gain: Time Series Analysis and Forecasting, Feature Engineering, Forecasting, Data-Driven Decision-Making, Trend Analysis, Predictive Modeling, Statistical Modeling, Statistical Analysis, Data Visualization, Exploratory Data Analysis, Data Processing, Sales Management, Pandas (Python Package), Jupyter
 Status: NewStatus: Free Trial
Skills you'll gain: Matplotlib, Statistical Modeling, Descriptive Statistics
 Status: Preview
Rice University
Skills you'll gain: Microsoft Excel, Pivot Tables And Charts, Spreadsheet Software, Excel Formulas, Data Visualization Software, Graphing, Data Analysis, Scatter Plots, Histogram, Data Manipulation, Data Import/Export
In summary, here are 10 of our most popular échantillonnage (statistiques) courses
- Matplotlib: Python Data Visualization & Wrangling: EDUCBA
- Seaborn Python Data Visualization & Analysis: EDUCBA
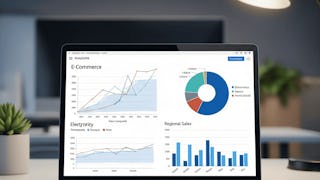
- Matplotlib with Python: E-commerce Data Visualization: EDUCBA
- Statistics and Data Analysis with Excel: Macquarie University
- Economie du sol et de l'immobilier I: École Polytechnique Fédérale de Lausanne
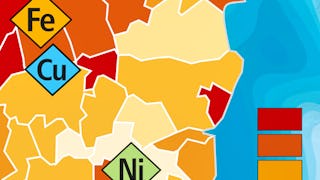
- Cartographie thématique: École normale supérieure
- SAS: Apply & Evaluate Poisson & Negative Binomial Models: EDUCBA
- Exploration et production de données pour les entreprises: University of Illinois Urbana-Champaign
- Cours intensif sur la science des données: Johns Hopkins University
- Python: Apply & Evaluate Sales Forecasting with Time Series: EDUCBA


